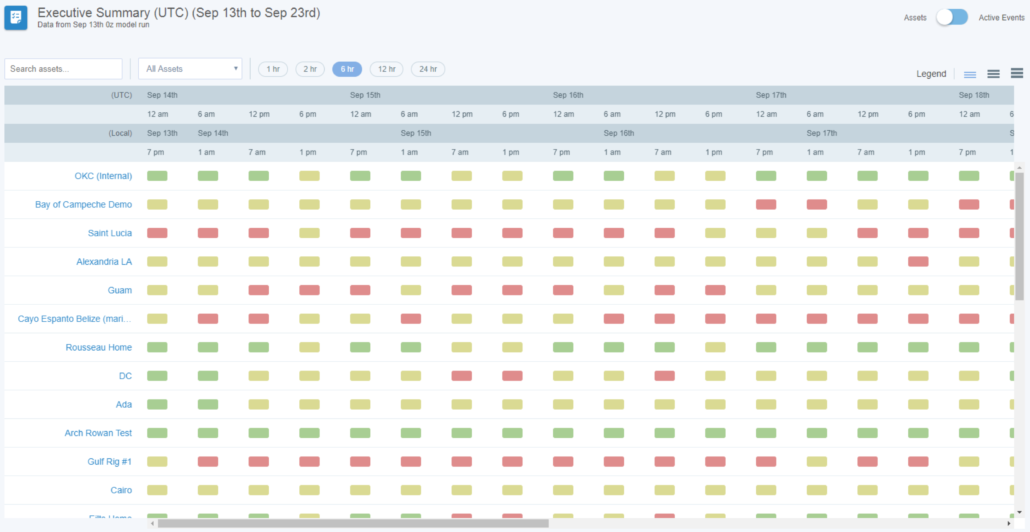
We’ve taken our threat matrix from all Daily Planners and compressed it so you can see all of your assets in one place simultaneously. At a glance, you will quickly identify assets that may require focus in the following days. The temporal resolution in this report is customizable just like the dynamic planners.

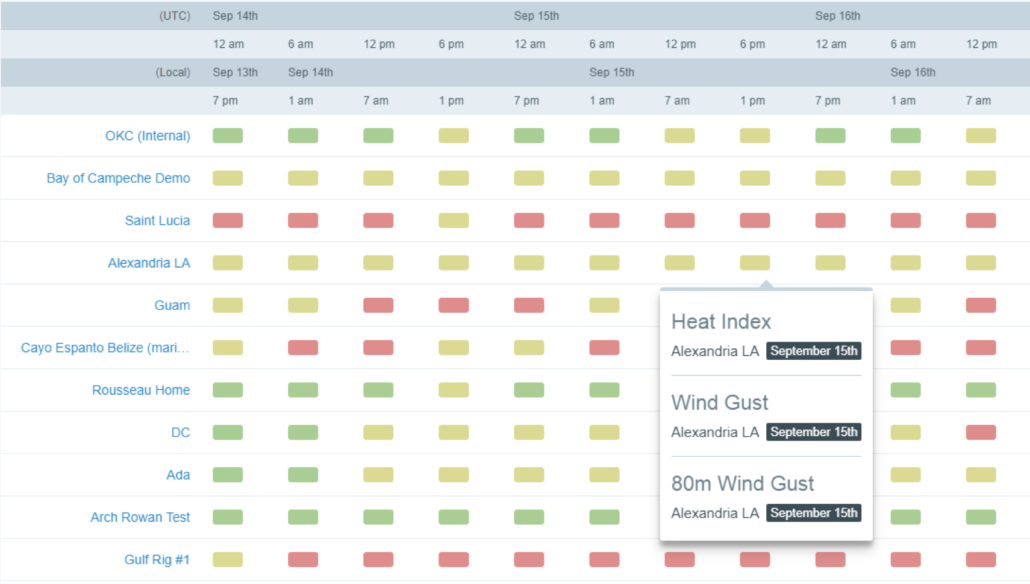
If you hover over a yellow or red box, a dialog box will show you which weather parameter(s) is triggering the yellow or red threat level. All triggers are customizable through the Daily Planner/Weather Check settings.

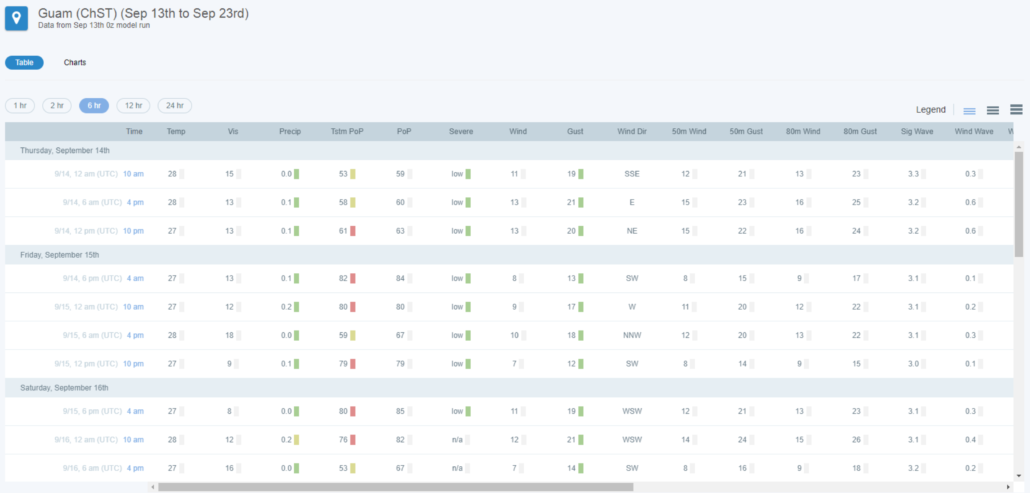
Clicking on an asset name or a yellow or red trigger box will take you into the individual asset’s Dynamic Planner. There is both a table and charts view, allowing users to access the most up-to-date forecast for that location, along with the familiar red, yellow, and green thresholds. The time increments are customizable in both the table and charts view.
