The WeatherOps Display, our interactive map, is web-based and cloud-delivered to provide users with complete weather decision support. It is the foundation of our suite of services, overlaying weather data and decision analytic layers on a global map that offers different views to meet your asset monitoring needs.
Upon launching the WeatherOps Display from the Commander Dashboard, all default layers will be automatically overlaid on the map and zoomed to the area of interest. These default map settings can be configured in the Map Settings. Asset locations, lightning range rings, radar, lightning strikes, and WeatherOps Hazards are common default layers.
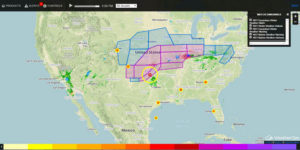
Products
Choose the “Products” tab in the upper left-hand corner. All of the products are categorized by icons, including Assets, General (Satellite, Surface Observations, and Past data), Radar, Lightning, Severe, and Tropical. Each product can be toggled on and off. All of your active products are shown at the bottom of the sidebar. The product legends are shown at the bottom of the map and can be hovered over for details.
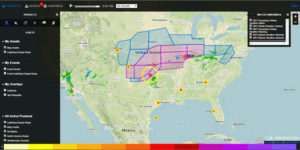
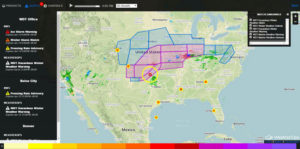
Alerts
Selecting “Alerts” from the top of the sidebar changes the panel to show all active alerts by asset. There is an icon next to the Alerts header indicating the number of active alerts. Clicking on an alert in the side panel, or on the map, will bring up additional information concerning it. Our interactive mapping system will deliver asset threats to you visually and audibly as a pop-up notification, as soon as your sites come under alert.
Controls
The “Controls” tab allows users to change the base map, switch to Metric units, and change product opacity. Users can also customize the notification settings here, as well as use the distance measuring tool.

Animate
Controls at the top center of the page allow you to animate the map or step through the available data frames. There is also an asset drop-down menu that allows zooming down to one specific asset.