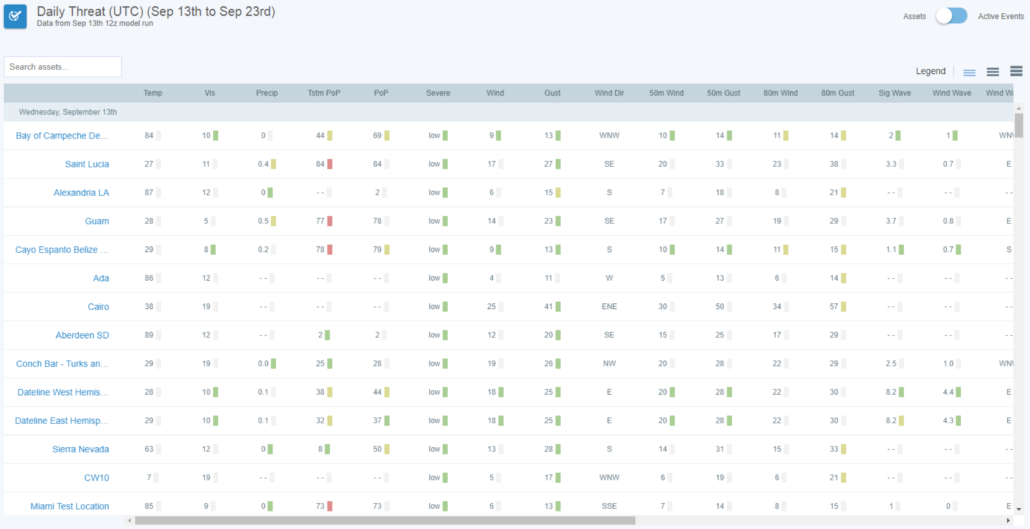
The Daily Threat Report allows you to “manage by exception.” This report only shows the assets with impending weather threats broken out by day. Only assets with yellow or red triggers will be shown each day. For event clients, you can also toggle the view to show only active events.

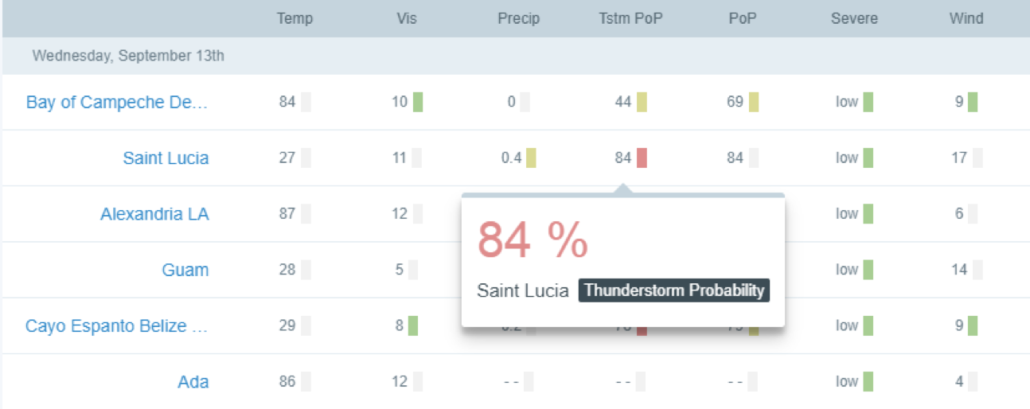
If you hover over any of the trigger boxes, a dialog box will give you more details about that weather parameter. All triggers are customizable through the Daily Planner/Weather Check settings.

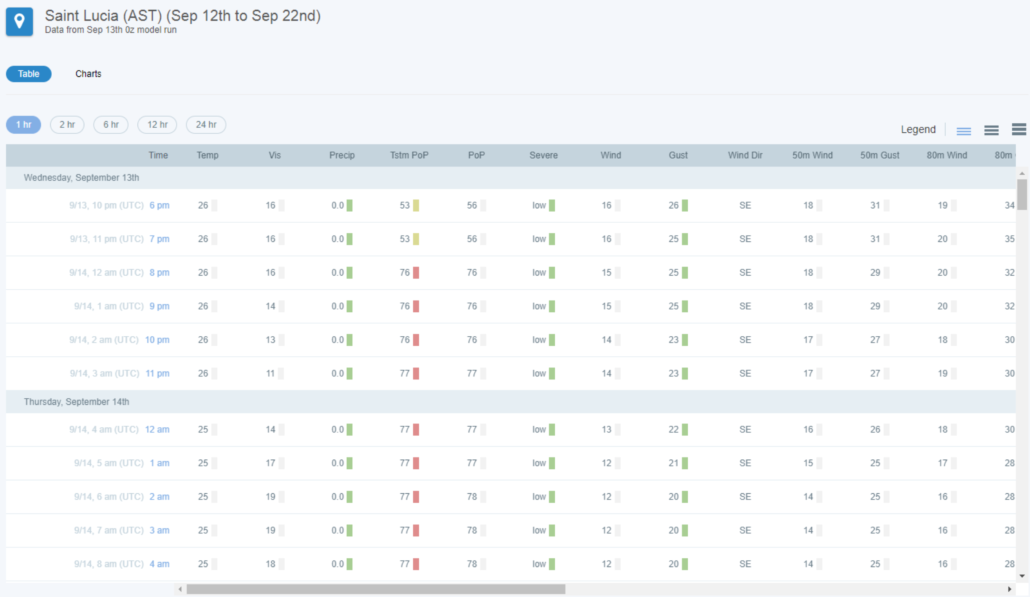
Clicking on an asset name will take you into the individual asset’s Dynamic Planner. There is both a table and charts view, allowing users to access the most up-to-date forecast for that location, along with the familiar red, yellow, and green thresholds. The time increments are customizable in both the table and charts view, letting you drill down to more specific times that weather triggers will be met.
